


The Best & Worst States for Child Vaccination Rates [2026 Update]
Child vaccination rates in the U.S. vary across states. The 10 states with the highest child vaccination rates have an average of 83% 7-series vaccination record, whereas the 10 states with the lowest child vaccination rates have an average of 69% 7-series vaccination record. The best states and worst states for vaccinating children are represented in every region throughout the country.
Read moreFree Medicare Insurance Comparison
Compare Quotes From Top Companies and Save
Shawn Laib
Insurance and Finance Writer
Since graduating from the University of WA with a B.A. in English Literature, Shawn has been professionally writing in the spheres of entertainment, insurance, business, marketing, and politics. He is passionate about using his writing skills and insurance knowledge to educate the general population on everyday issues surrounding these misunderstood topics. His work has been published on SUPERJ...
Insurance and Finance Writer
UPDATED: Nov 14, 2023
It’s all about you. We want to help you make the right coverage choices.
Advertiser Disclosure: We strive to help you make confident insurance decisions. Comparison shopping should be easy. We are not affiliated with any one insurance provider and cannot guarantee quotes from any single provider.
Our insurance industry partnerships don’t influence our content. Our opinions are our own. To compare quotes from many different insurance companies please enter your ZIP code on this page to use the free quote tool. The more quotes you compare, the more chances to save.
Editorial Guidelines: We are a free online resource for anyone interested in learning more about insurance. Our goal is to be an objective, third-party resource for everything insurance related. We update our site regularly, and all content is reviewed by insurance experts.
UPDATED: Nov 14, 2023
It’s all about you. We want to help you make the right coverage choices.
Advertiser Disclosure: We strive to help you make confident insurance decisions. Comparison shopping should be easy. We are not affiliated with any one insurance provider and cannot guarantee quotes from any single provider.
Our insurance industry partnerships don’t influence our content. Our opinions are our own. To compare quotes from many different insurance companies please enter your ZIP code on this page to use the free quote tool. The more quotes you compare, the more chances to save.
On This Page
- Montana is the worst state with just a 64% 7-vaccine series of children
- Measles cases are at their highest point since 1992
- Impoverished children are most likely to complete the 7-vaccine series
- Blacks and Native Americans have the lowest vaccination rates of all races
Thanks to a worldwide vaccination effort led by the World Health Organization, smallpox became the first disease to be completely eradicated in 1978. Since then, the United States has eliminated other diseases including polio (in 1979) and measles (in 2000) as a result of the collective immunity acquired through vaccination rates in the U.S.
However, in the last several years, diseases like measles have returned to the U.S., with a significant spike in the number of cases reported. This article dives deep into the best and worst states for vaccinating children.
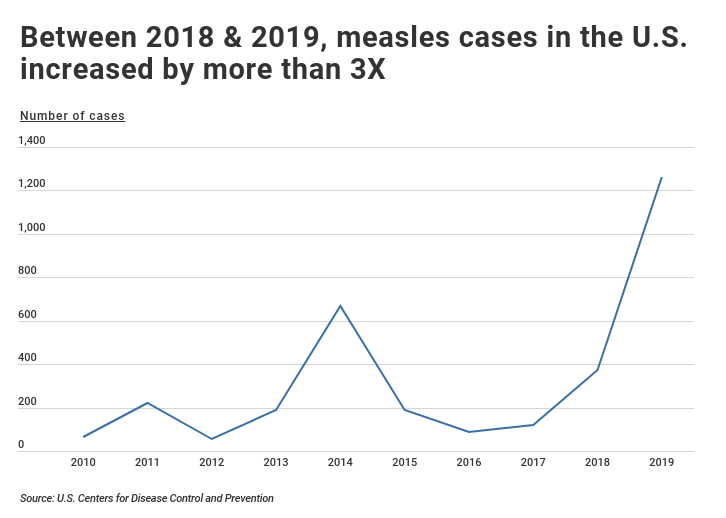
New data from the CDC shows a more than 3X increase in the number of measles cases between 2018 and 2019.
The number of reported measles cases in 2019 is the highest since 1992, countering a long-term downward trend since the measles vaccination program started in 1963.
While the current measles vaccine is about 97 percent effective at preventing the disease, the majority of new measles cases are among groups of people who were not vaccinated.
Disparities in vaccination rates have long persisted across certain demographic groups due to differences in health care access. For example, affluent children are more likely to be vaccinated than children in low-income communities. However, increased parental concern over vaccine safety and efficacy has rejuvenated a social movement aiming to prevent children’s vaccinations.
The anti-vaccination movement, which gained prominence in the U.S. through social media and television talk shows, is weakening the nation’s collective immunity.
This became particularly evident in 2014 during one of the most infamous measles outbreaks in recent years, which originated in Disneyland and spread to 111 cases nationwide.
Some victims were too young to have been vaccinated, but almost half did not receive vaccines due to “philosophical or religious objections,” a phenomenon that has been growing in recent years.
Given recent outbreaks in measles and the rise of the anti-vaccination movement, researchers here at expertinsurancereviews.com wanted to find which states are best and worst at vaccinating their children.
Using data from the Centers for Disease Control and Prevention’s National Immunization Survey, we examined how many children have completed the combined 7-vaccine series, which includes:
- 4 or more doses of DTaP
- 3 or more doses of Polio
- 1 or more dose of MMR
- Hib full series (3 or 4 doses)
- 3 or more doses of HepB
- 1 or more dose of Varicella
- 4 or more doses of PCV
There are large differences in vaccination rates across many state lines; for example, Montana and North Dakota are at opposite ends of the spectrum despite their geographic proximity.
Interestingly, Western states including Oregon, Arizona, and Washington, which ordinarily score well in health-related measures, have low vaccination rates among kids. With the exception of New York State, New England is the only region with consistently high combined vaccination rates in the U.S.
If you’re on this page, we know you’re probably interested in insurance as well. Insurance can sometimes be a difficult subject to understand with all the industry terminology and the wide array of choices available for both coverages and companies.
If you want to switch companies to save money that can be put towards annual vaccinations, we put together a guide to the best insurance companies from auto, life, and health insurance segments. If you’re looking to get a quote right away, just enter your ZIP code into our FREE online quote comparison tool. It’ll give you the best rates for your area based on your demographic information.
In this article, we’ll look at states with the lowest and highest vaccination rates, vaccination rates by state according to the CDC (Centers for Disease Control and Prevention), and specifically childhood vaccination rates by state.
There are other topics you might be interested in, such as:
- Vaccination exemption rates by state
- Vaccination coverage rates by state
Those will be touched on in the frequently asked question section. Now, let’s jump into the 20 best and worst states starting with the 10 with the most children immunized against these diseases.
The 10 States with the Highest Child Vaccination Rates
#10 – New Hampshire
- Combined 7-vaccine series: 79.8%
- DTaP (≥4 doses): 91.1%
- Polio (≥3 doses): 95.9%
- MMR (≥1 dose): 93.0%
- Hib (full series): 87.6%
- HepB (≥3 doses): 73.2%
- Varicella (≥1 dose): 89.2%
- PCV (≥4 doses): 86.0%
#9 – Colorado
- Combined 7-vaccine series: 80.0%
- DTaP (≥4 doses): 89.9%
- Polio (≥3 doses): 91.3%
- MMR (≥1 dose): 92.8%
- Hib (full series): 87.8%
- HepB (≥3 doses): 73.2%
- Varicella (≥1 dose): 91.1%
- PCV (≥4 doses): 85.2%
TRENDING
Our research team spends hundreds of hours finding the best health insurance companies, so you don’t have to. For guides to the heavy-hitting health insurance companies, check out our Blue Cross Blue Shield review, Coventry review, or Colonial Penn Insurance review.
#8 – North Carolina
- Combined 7-vaccine series: 80.8%
- DTaP (≥4 doses): 89.8%
- Polio (≥3 doses): 96.2%
- MMR (≥1 dose): 94.0%
- Hib (full series): 87.1%
- HepB (≥3 doses): 73.7%
- Varicella (≥1 dose): 94.4%
- PCV (≥4 doses): 88.9%
#7 – Alabama
- Combined 7-vaccine series: 81.3%
- DTaP (≥4 doses): 91.1%
- Polio (≥3 doses): 93.9%
- MMR (≥1 dose): 94.8%
- Hib (full series): 88.0%
- HepB (≥3 doses): 78.3%
- Varicella (≥1 dose): 94.4%
- PCV (≥4 doses): 86.3%
#6 – Pennsylvania
- Combined 7-vaccine series: 81.5%
- DTaP (≥4 doses): 89.1%
- Polio (≥3 doses): 94.2%
- MMR (≥1 dose): 96.1%
- Hib (full series): 86.1%
- HepB (≥3 doses): 83.4%
- Varicella (≥1 dose): 94.5%
- PCV (≥4 doses): 92.5%
#5 – Iowa
- Combined 7-vaccine series: 81.9%
- DTaP (≥4 doses): 92.4%
- Polio (≥3 doses): 96.0%
- MMR (≥1 dose): 92.9%
- Hib (full series): 87.6%
- HepB (≥3 doses): 82.3%
- Varicella (≥1 dose): 91.2%
- PCV (≥4 doses): 92.5%
Your one-stop online insurance guide. Get free quotes now!
#4 – Connecticut
- Combined 7-vaccine series: 85.2%
- DTaP (≥4 doses): 93.1%
- Polio (≥3 doses): 97.7%
- MMR (≥1 dose): 96.3%
- Hib (full series): 90.9%
- HepB (≥3 doses): 80.2%
- Varicella (≥1 dose): 99.5%
- PCV (≥4 doses): 90.8%
#3 – Nebraska
- Combined 7-vaccine series: 85.5%
- DTaP (≥4 doses): 95.3%
- Polio (≥3 doses): 95.1%
- MMR (≥1 dose): 94.9%
- Hib (full series): 92.0%
- HepB (≥3 doses): 87.4%
- Varicella (≥1 dose): 95.4%
- PCV (≥4 doses): 92.2%
#2 – North Dakota
- Combined 7-vaccine series: 85.6%
- DTaP (≥4 doses): 90.2%
- Polio (≥3 doses): 95.1%
- MMR (≥1 dose): 93.6%
- Hib (full series): 90.3%
- HepB (≥3 doses): 88.2%
- Varicella (≥1 dose): 92.2%
- PCV (≥4 doses): 89.5%
DID YOU KNOW?
For most young people, term life insurance is a better choice than whole life insurance. Our article why term is better than whole life insurance dives deep into that issue.
#1 – Massachusetts
- Combined 7-vaccine series: 85.9%
- DTaP (≥4 doses): 92.5%
- Polio (≥3 doses): 97.5%
- MMR (≥1 dose): 96.9%
- Hib (full series): 92.3%
- HepB (≥3 doses): 74.8%
- Varicella (≥1 dose): 97.3%
- PCV (≥4 doses): 93.3
The 10 States with the Lowest Child Vaccination Rates
#10 – New York
- Combined 7-vaccine series: 70.9%
- DTaP (≥4 doses): 85.7%
- Polio (≥3 doses): 94.8%
- MMR (≥1 dose): 93.0%
- Hib (full series): 83.3%
- HepB (≥3 doses): 72.0%
- Varicella (≥1 dose): 93.4%
- PCV (≥4 doses): 86.6%
#9 – Florida
- Combined 7-vaccine series: 70.8%
- DTaP (≥4 doses): 85.7%
- Polio (≥3 doses): 94.1%
- MMR (≥1 dose): 92.6%
- Hib (full series): 79.6%
- HepB (≥3 doses): 66.2%
- Varicella (≥1 dose): 92.9%
- PCV (≥4 doses): 79.9%
#8 – Arizona
- Combined 7-vaccine series: 70.7%
- DTaP (≥4 doses): 84.5%
- Polio (≥3 doses): 90.6%
- MMR (≥1 dose): 91.1%
- Hib (full series): 76.7%
- HepB (≥3 doses): 79.6%
- Varicella (≥1 dose): 91.8%
- PCV (≥4 doses): 76.2%
Your one-stop online insurance guide. Get free quotes now!
#7 – Missouri
- Combined 7-vaccine series: 70.4%
- DTaP (≥4 doses): 80.4%
- Polio (≥3 doses): 96.6%
- MMR (≥1 dose): 88.1%
- Hib (full series): 75.5%
- HepB (≥3 doses): 84.3%
- Varicella (≥1 dose): 89.2%
- PCV (≥4 doses): 78.9%
#6 – Mississippi
- Combined 7-vaccine series: 70.2%
- DTaP (≥4 doses): 81.1%
- Polio (≥3 doses): 92.3%
- MMR (≥1 dose): 91.3%
- Hib (full series): 78.7%
- HepB (≥3 doses): 75.5%
- Varicella (≥1 dose): 92.0%
- PCV (≥4 doses): 79.1%
#5 – South Carolina
- Combined 7-vaccine series: 70.1%
- DTaP (≥4 doses): 89.2%
- Polio (≥3 doses): 94.2%
- MMR (≥1 dose): 89.8%
- Hib (full series): 80.0%
- HepB (≥3 doses): 71.3%
- Varicella (≥1 dose): 92.4%
- PCV (≥4 doses): 85.3%
#4 – Minnesota
- Combined 7-vaccine series: 68.9%
- DTaP (≥4 doses): 82.5%
- Polio (≥3 doses): 93.5%
- MMR (≥1 dose): 93.2%
- Hib (full series): 81.5%
- HepB (≥3 doses): 68.0%
- Varicella (≥1 dose): 91.2%
- PCV (≥4 doses): 83.0%
RELATED
If you are young and in great health, don’t buy health insurance on the individual market. There are probably better alternatives for you to consider.
#3 – Washington
- Combined 7-vaccine series: 68.6%
- DTaP (≥4 doses): 84.4%
- Polio (≥3 doses): 88.3%
- MMR (≥1 dose): 93.8%
- Hib (full series): 76.9%
- HepB (≥3 doses): 72.0%
- Varicella (≥1 dose): 93.0%
- PCV (≥4 doses): 80.4%
Your one-stop online insurance guide. Get free quotes now!
#2 – Indiana
- Combined 7-vaccine series: 67.3%
- DTaP (≥4 doses): 82.2%
- Polio (≥3 doses): 93.4%
- MMR (≥1 dose): 92.1%
- Hib (full series): 76.0%
- HepB (≥3 doses): 78.6%
- Varicella (≥1 dose): 89.4%
- PCV (≥4 doses): 77.5%
#1 – Montana
- Combined 7-vaccine series: 64.0%
- DTaP (≥4 doses): 81.0%
- Polio (≥3 doses): 93.5%
- MMR (≥1 dose): 92.1%
- Hib (full series): 76.3%
- HepB (≥3 doses): 75.4%
- Varicella (≥1 dose): 89.7%
- PCV (≥4 doses): 79.3%
All States + D.C. Child Vaccination % Ranked
| State | Rank | Avg | DTaP | Polio | MMR | Hib | HepB | Varicella | PCV |
|---|---|---|---|---|---|---|---|---|---|
| Massachusetts | 1 | 85.9% | 92.5% | 97.5% | 96.9% | 92.3% | 74.8% | 97.3% | 93.3% |
| North Dakota | 2 | 85.6% | 90.2% | 95.1% | 93.6% | 90.3% | 88.2% | 92.2% | 89.5% |
| Nebraska | 3 | 85.5% | 95.3% | 95.1% | 94.9% | 92.0% | 87.4% | 95.4% | 92.2% |
| Connecticut | 4 | 85.2% | 93.1% | 97.7% | 96.3% | 90.9% | 80.2% | 99.5% | 90.8% |
| Iowa | 5 | 81.9% | 92.4% | 96.0% | 92.9% | 87.6% | 82.3% | 91.2% | 92.5% |
| Pennsylvania | 6 | 81.5% | 89.1% | 94.2% | 96.1% | 86.1% | 83.4% | 94.5% | 92.5% |
| Alabama | 7 | 81.3% | 91.1% | 93.9% | 94.8% | 88.0% | 78.3% | 94.4% | 86.3% |
| North Carolina | 8 | 80.8% | 89.8% | 96.2% | 94.0% | 87.1% | 73.7% | 94.4% | 88.9% |
| Colorado | 9 | 80.0% | 89.9% | 91.3% | 92.8% | 87.8% | 73.2% | 91.1% | 85.2% |
| New Hampshire | 10 | 79.8% | 91.1% | 95.9% | 93.0% | 87.6% | 73.2% | 89.2% | 86.0% |
| Kentucky | 11 | 79.3% | 91.9% | 99.0% | 95.4% | 88.2% | 83.9% | 95.3% | 89.9% |
| Illinois | 12 | 79.1% | 90.4% | 96.2% | 94.1% | 86.2% | 75.0% | 95.2% | 88.1% |
| Vermont | 13 | 79.0% | 86.6% | 94.0% | 91.5% | 85.6% | 58.1% | 90.4% | 87.7% |
| New Mexico | 14 | 78.8% | 91.3% | 96.4% | 93.6% | 86.2% | 70.0% | 92.3% | 85.8% |
| West Virginia | 15 | 78.6% | 89.3% | 93.9% | 92.8% | 88.4% | 72.9% | 92.0% | 87.6% |
| Arkansas | 16 | 78.6% | 90.9% | 93.6% | 96.5% | 86.4% | 76.3% | 94.8% | 81.5% |
| New Jersey | 17 | 78.4% | 90.1% | 95.5% | 96.5% | 87.2% | 68.0% | 94.2% | 88.3% |
| Wisconsin | 18 | 78.0% | 89.8% | 96.0% | 98.0% | 85.9% | 81.5% | 97.7% | 85.2% |
| Delaware | 19 | 77.4% | 90.8% | 95.4% | 94.2% | 83.8% | 81.2% | 94.3% | 92.0% |
| Maine | 20 | 77.3% | 94.7% | 94.0% | 94.0% | 84.3% | 70.1% | 93.9% | 87.7% |
| South Dakota | 21 | 76.8% | 84.7% | 91.0% | 95.5% | 84.3% | 79.2% | 95.0% | 87.8% |
| Maryland | 22 | 76.6% | 85.7% | 94.0% | 93.6% | 87.3% | 75.1% | 92.8% | 85.0% |
| Georgia | 23 | 76.5% | 88.3% | 96.3% | 94.3% | 84.0% | 77.4% | 94.5% | 83.6% |
| Virginia | 24 | 76.4% | 91.5% | 96.9% | 92.8% | 85.7% | 74.2% | 96.5% | 91.4% |
| Tennessee | 25 | 76.1% | 89.4% | 93.3% | 93.0% | 84.6% | 71.2% | 93.8% | 80.8% |
| Idaho | 26 | 75.9% | 87.0% | 91.8% | 94.4% | 85.1% | 73.1% | 93.6% | 85.1% |
| Utah | 27 | 75.9% | 87.2% | 92.3% | 90.5% | 82.6% | 85.2% | 90.6% | 84.0% |
| Texas | 28 | 75.7% | 89.1% | 94.8% | 93.0% | 84.3% | 79.4% | 92.6% | 85.4% |
| Kansas | 29 | 75.7% | 83.8% | 94.2% | 95.9% | 81.9% | 67.6% | 98.8% | 85.3% |
| Rhode Island | 30 | 75.1% | 89.4% | 97.5% | 94.9% | 86.8% | 79.7% | 96.3% | 92.4% |
| Louisiana | 31 | 74.7% | 83.8% | 95.6% | 94.4% | 87.3% | 79.8% | 94.4% | 83.1% |
| Hawaii | 32 | 74.3% | 89.8% | 92.4% | 93.0% | 81.9% | 75.9% | 87.5% | 84.8% |
| District of Columbia | 33 | 73.3% | 91.2% | 94.3% | 91.9% | 82.5% | 75.2% | 93.4% | 87.2% |
| Ohio | 34 | 73.2% | 90.1% | 92.5% | 94.0% | 81.5% | 78.8% | 89.7% | 84.0% |
| Michigan | 35 | 73.2% | 84.7% | 94.9% | 94.4% | 83.1% | 77.7% | 96.3% | 82.9% |
| Wyoming | 36 | 72.6% | 82.0% | 92.9% | 89.2% | 85.0% | 62.5% | 89.6% | 82.1% |
| California | 37 | 72.2% | 87.8% | 91.9% | 92.0% | 82.1% | 68.9% | 98.1% | 80.2% |
| Alaska | 38 | 71.9% | 80.4% | 91.4% | 88.8% | 82.6% | 69.7% | 85.3% | 80.7% |
| Nevada | 39 | 71.3% | 84.5% | 90.2% | 92.0% | 80.5% | 76.4% | 91.1% | 80.1% |
| Oklahoma | 40 | 71.2% | 86.1% | 94.0% | 91.9% | 82.3% | 78.5% | 92.8% | 82.0% |
| Oregon | 41 | 71.1% | 81.0% | 95.0% | 94.9% | 79.9% | 77.3% | 94.1% | 83.3% |
| New York | 42 | 70.9% | 85.7% | 94.8% | 93.0% | 83.3% | 72.0% | 93.4% | 86.6% |
| Florida | 43 | 70.8% | 85.7% | 94.1% | 92.6% | 79.6% | 66.2% | 92.9% | 79.9% |
| Arizona | 44 | 70.7% | 84.5% | 90.6% | 91.1% | 76.7% | 79.6% | 91.8% | 76.2% |
| Missouri | 45 | 70.4% | 80.4% | 96.6% | 88.1% | 75.5% | 84.3% | 89.2% | 78.9% |
| Mississippi | 46 | 70.2% | 81.1% | 92.3% | 91.3% | 78.7% | 75.5% | 92.0% | 79.1% |
| South Carolina | 47 | 70.1% | 89.2% | 94.2% | 89.8% | 80.0% | 71.3% | 92.4% | 85.3% |
| Minnesota | 48 | 68.9% | 82.5% | 93.5% | 93.2% | 81.5% | 68.0% | 91.2% | 83.0% |
| Washington | 49 | 68.6% | 84.4% | 88.3% | 93.8% | 76.9% | 72.0% | 93.0% | 80.4% |
| Indiana | 50 | 67.3% | 82.2% | 93.4% | 92.1% | 76.0% | 78.6% | 89.4% | 77.5% |
| Montana | 51 | 64.0% | 81.0% | 93.5% | 92.1% | 76.3% | 75.4% | 89.7% | 79.3% |
Methodology: Determining the Best & Worst States for Vaccinating Children
Data on children’s vaccination coverage for the combined 7-vaccine series are from the Centers for Disease Control and Prevention’s National Immunization Survey. The combined 7-vaccine series includes 4 or more doses of DTaP, 3 or more doses of Polio, 1 or more doses of MMR, Hib full series (3 or 4 doses, depending on product type received), 3 or more doses of HepB, 1 or more doses of Varicella, and 4 or more doses of PCV.
Vaccine statistics by state are for 19- to 35-month old children born in 2015 and 2016. The numbers of measles cases by year, as well as vaccination rates by demographic group, are also from the CDC.
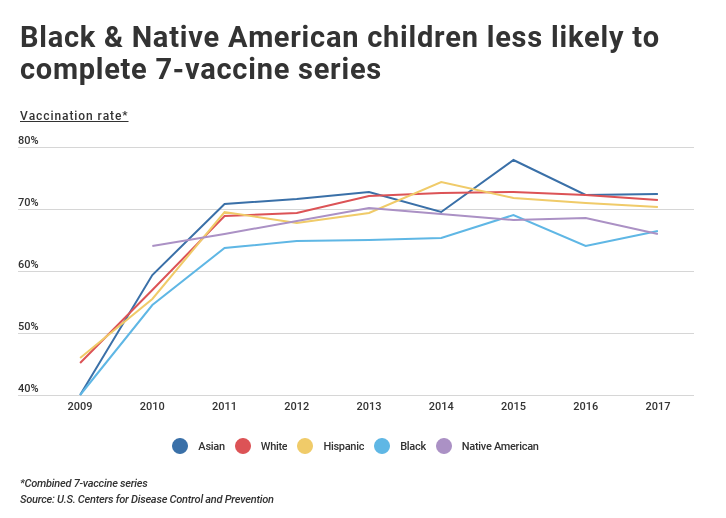
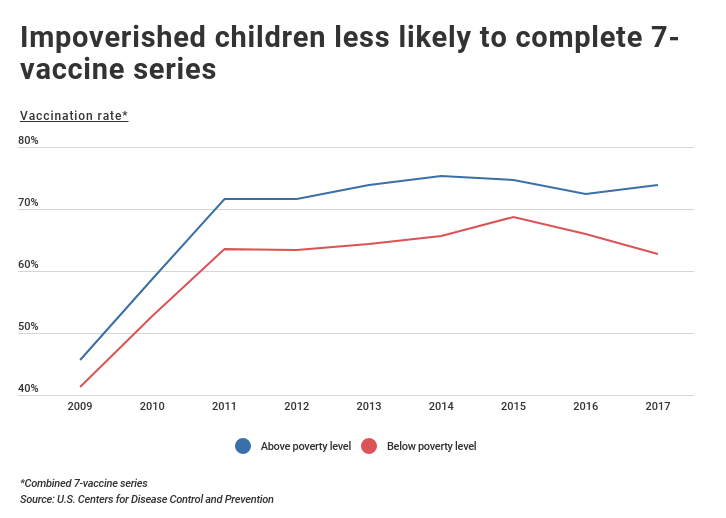
Race plays a significant role when it comes to vaccinations. Nationally, there is a consistent gap of almost 6 percentage points between the vaccination rate of whites and Asians compared to African-Americans and Native Americans. A characteristic even more impactful than race is poverty status—the analysis found that those below the poverty level have lower vaccination rates by 10 percentage points, a gap which has been consistent for the last decade, and which poses a serious health threat.
Despite the recent outbreaks in the U.S. and abroad, the combined 7-vaccine series rate has actually increased from 40 percent to more than 70 percent nationally since 2009. This is largely thanks to more vaccinations for Rotavirus and Hib (influenza), which were previously at lower levels.
The most pressing issue today is that a number of close-knit communities choose to exempt their children from vaccinations, frequently due to “philosophical or religious” reasons.
In 2014, when the U.S. experienced the largest measles outbreak in decades, more than half of those infected were from an under-immunized Amish community, which chose not to vaccinate their children.
The MMR vaccine, which protects children from measles, mumps, and rubella, has been associated with sizable controversy ever since a study was published linking the vaccine to autism. While the study has been retracted and debunked numerous times, healthcare workers and researchers still struggle to persuade some parents to vaccinate their children.
During the eradication of smallpox campaign, non-existing infrastructure, war conflict, and lack of trust in health authorities proved to be the toughest challenges. Today, despite improvements in infrastructure and living conditions, misinformation and lack of trust in authorities are proving as difficult to overcome as 50 years ago.
There are also other ways to measure vaccination coverage, such as vaccination coverage by area or vaccination coverage by county. Those statistics can be eye-opening as to which demographics are deciding not to vaccinate their children.
Whether you suffer from one of the maladies mentioned in this article because you weren’t vaccinated or are perfectly healthy, it always helps to save money on insurance. Enter your ZIP code into our online quote generator today to get the best insurance rates for your area based on your information.
Frequently Asked Questions
What are the best states for child vaccination rates in the United States?
The following states have consistently shown high child vaccination rates, indicating strong adherence to recommended immunization schedules:
- Vermont
- Massachusetts
- Rhode Island
- New Hampshire
- Connecticut
What factors contribute to these states having high child vaccination rates?
Several factors can contribute to high child vaccination rates in these states, including:
- Strong public health infrastructure and access to healthcare services
- Effective public health campaigns and education on the importance of vaccines
- Well-established immunization registries and systems for tracking vaccination coverage
- Supportive state policies and regulations promoting vaccination
- High levels of trust in healthcare providers and confidence in vaccines
What are the worst states for child vaccination rates in the United States?
The following states have struggled with lower child vaccination rates compared to national averages:
- Idaho
- Alaska
- Montana
- Wyoming
- Colorado
What are some reasons behind low child vaccination rates in these states?
Several factors can contribute to lower child vaccination rates in these states, including:
- Limited access to healthcare services, especially in rural areas
- Challenges with vaccine affordability and insurance coverage
- Vaccine hesitancy or concerns about vaccine safety and effectiveness
- Weaker immunization infrastructure, such as inadequate vaccine delivery systems or registries
- Cultural or religious beliefs that may discourage vaccination
How does vaccination coverage in the best and worst states compare to national averages?
The best states for child vaccination rates often exceed the national average for vaccination coverage. Conversely, the worst states generally fall below the national average, indicating a need for improvement in vaccination efforts.
Are you looking for free insurance quotes?
Your one-stop online insurance guide. Get free quotes now!
Shawn Laib
Insurance and Finance Writer
Since graduating from the University of WA with a B.A. in English Literature, Shawn has been professionally writing in the spheres of entertainment, insurance, business, marketing, and politics. He is passionate about using his writing skills and insurance knowledge to educate the general population on everyday issues surrounding these misunderstood topics. His work has been published on SUPERJ...
Insurance and Finance Writer
Editorial Guidelines: We are a free online resource for anyone interested in learning more about insurance. Our goal is to be an objective, third-party resource for everything insurance related. We update our site regularly, and all content is reviewed by insurance experts.